
Turning Tides: The White House, IPOs, & Continued AI Dominance
The Tailwind Ventures Quarterly Market Summary is designed to cut through the noise and bring you the insights we believe are most relevant to the venture ecosystem.
The analysis in this summary is supported by data from PitchBook, NVCA, CVCA, and other reputable sources — but most importantly, it is informed by the dynamics we observe every day as we enable ventures to withstand the scrutiny of due diligence and secure capital.
TL;DR
- Annual GP fundraising is on pace for a decade low through H1 2025, with first-time fund managers struggling the most.
- Q2 deal value fell ~25% from Q1. VC investments are increasingly concentrated in growth-stage ventures with clear traction and trajectories, particularly in the AI and commercial products and services sectors.
- The AI sector single-handedly comprised ~61% and ~36% of Q2 deal value and deal count, respectively. AI deal value was driven by Scale AI’s US$14.3 billion venture-growth round — the second largest VC deal to date, following OpenAI’s US$40 billion venture-growth round in Q1. Thanks to both AI megadeals in H1 2025, annual venture-growth stage VC dealmaking is on pace for a record-setting high.
- Even if excluding these two outlier megadeals, H1 2025 venture-growth deal value is still strong at US$29.6 billion: ~71% higher than H1 2024 venture-growth deal value, outpacing every H1 since venture market highs 2021.
- The annual share of sub-US$5 million VC deals as a proportion of total VC deal count has fallen from ~55% in 2024 down to ~49% through H1 2025, which is on pace for a decade low, further reflecting that venture investors are increasingly opting to make fewer but larger investments, in quality businesses with lower risk-reward profiles.
- Q2 continued a steep rebound in YTD exit activity, driven by Circle and Voyager’s high-profile IPOs in June. IPO exit values through H1 2025 already exceed IPO exit values through all of 2024.
- The ‘One Big Beautiful Bill Act’ largely provides mixed signals for VC, though clearly prioritizing long-term growth within defense tech, AI, fintech, and crypto
The GP Fundraising Landscape: A Decade Low for All but A Win for Experience
Fundraising statistics at the GP level through H1 2025 paint a stark picture of LP investor sentiment:
- US$26.6 billion raised across 238 VC funds — on pace for a decade low in annual GP fundraising.
- First-time managers faced especially strong headwinds amidst the GP fundraising slowdown — highlighting LPs’ growing preference for investing in venture with established managers, if at all.
- The median time to close a VC fund increased by ~21% from 2024 — a concerning milestone, suggesting that LPs are reluctant to commit capital to the venture asset class.
- Corporate venture capital participation fell — especially on seed deals, indicating decreased corporate risk appetites.
US First-Time Managers Vs Established Managers — Capital Raised & Fund Count
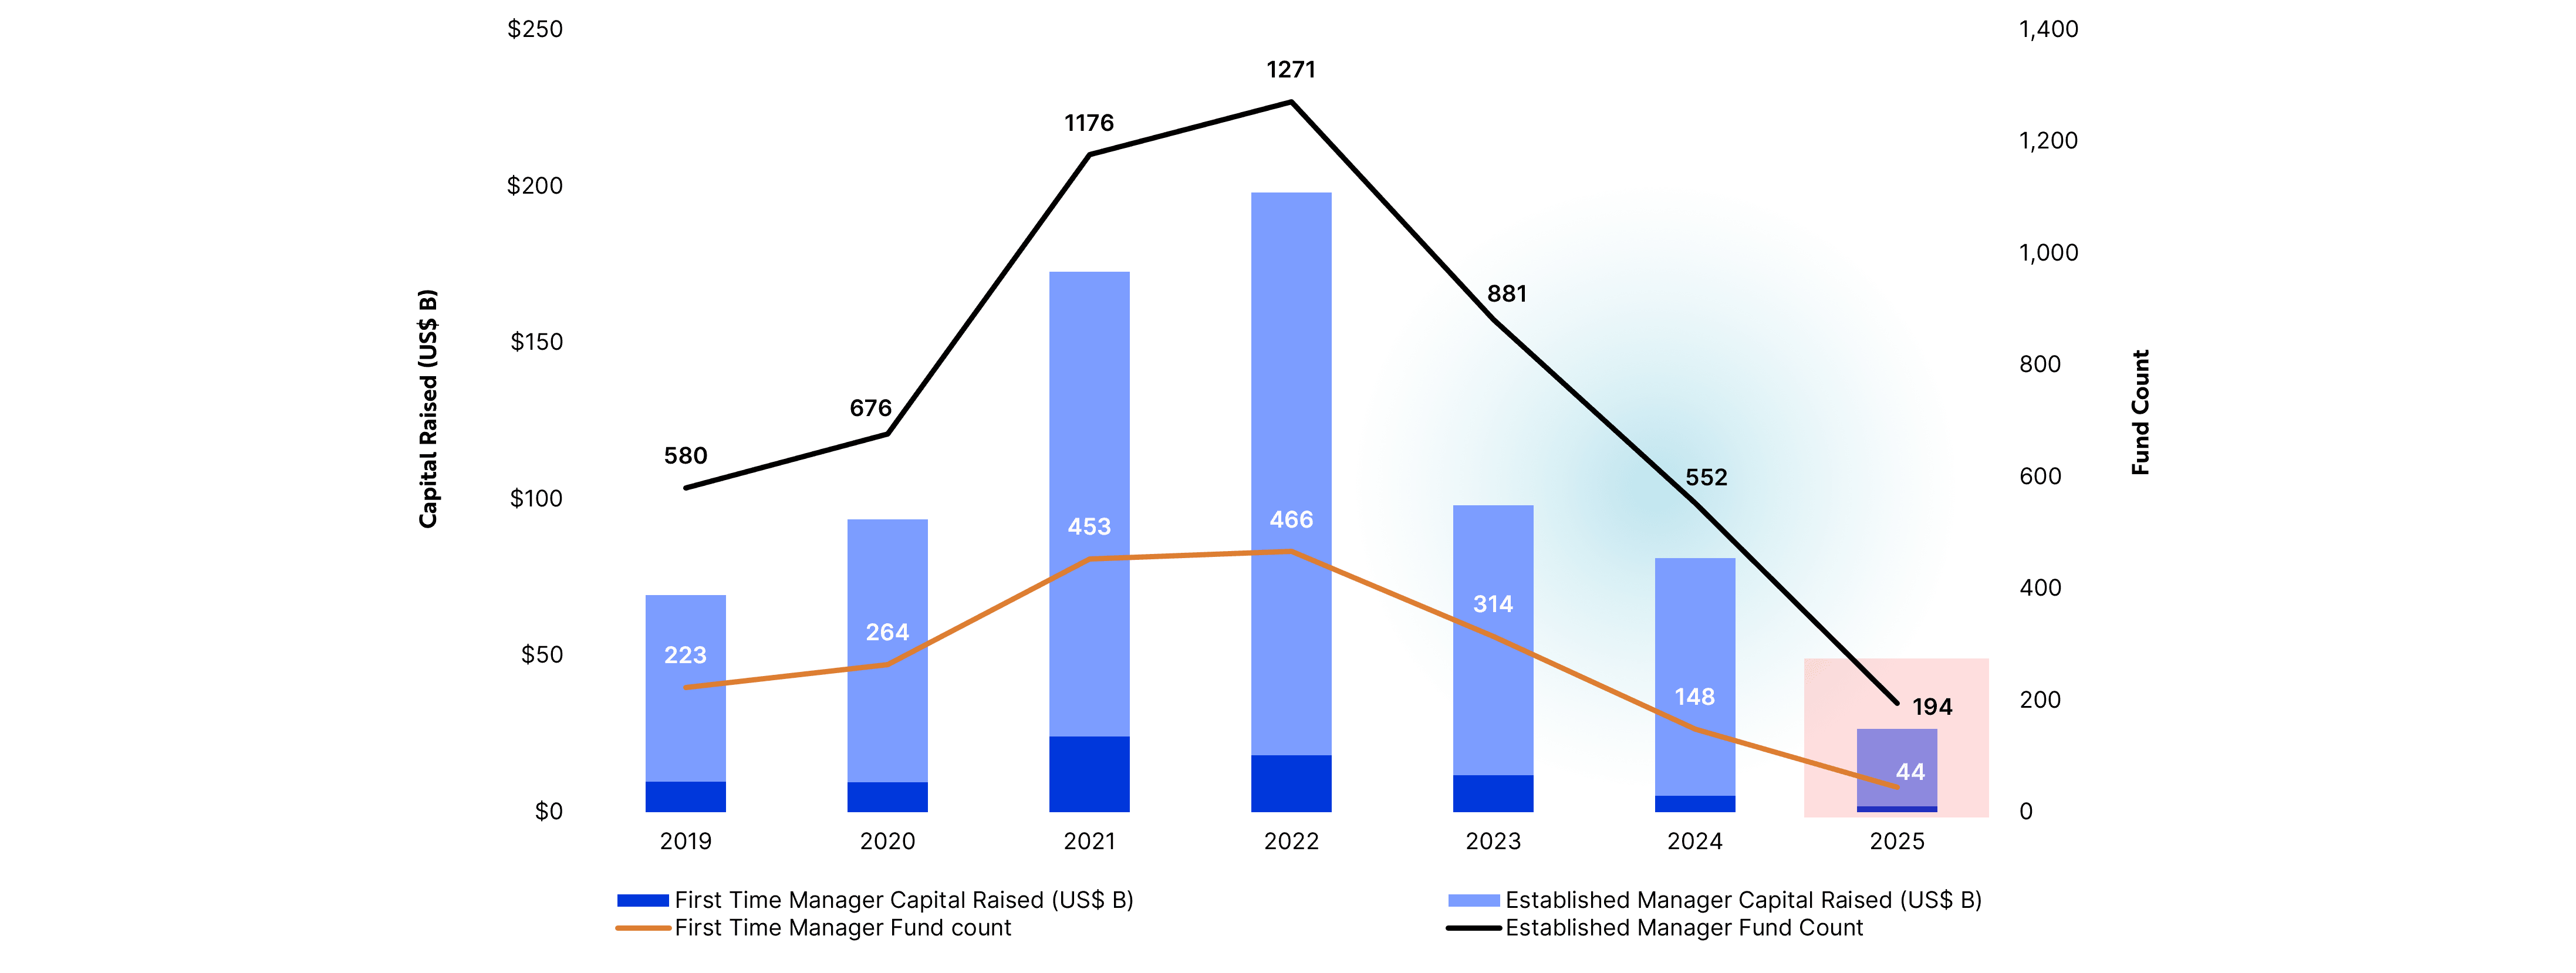
Our analysis above shows a continuation of the steep decline in GP fundraising since 2022, as annual GP fundraising through H1 2025 is on pace for a decade low.
First-time managers are facing particularly sharp setbacks, comprising an ever-dwindling share of fundraising activity through H1 2025, as LPs look to invest in venture with established managers, if at all.
The AI + Commercial Products & Services Sectors Are Driving Q2 2025 Dealmaking
Quarterly US VC Deal Value & Count
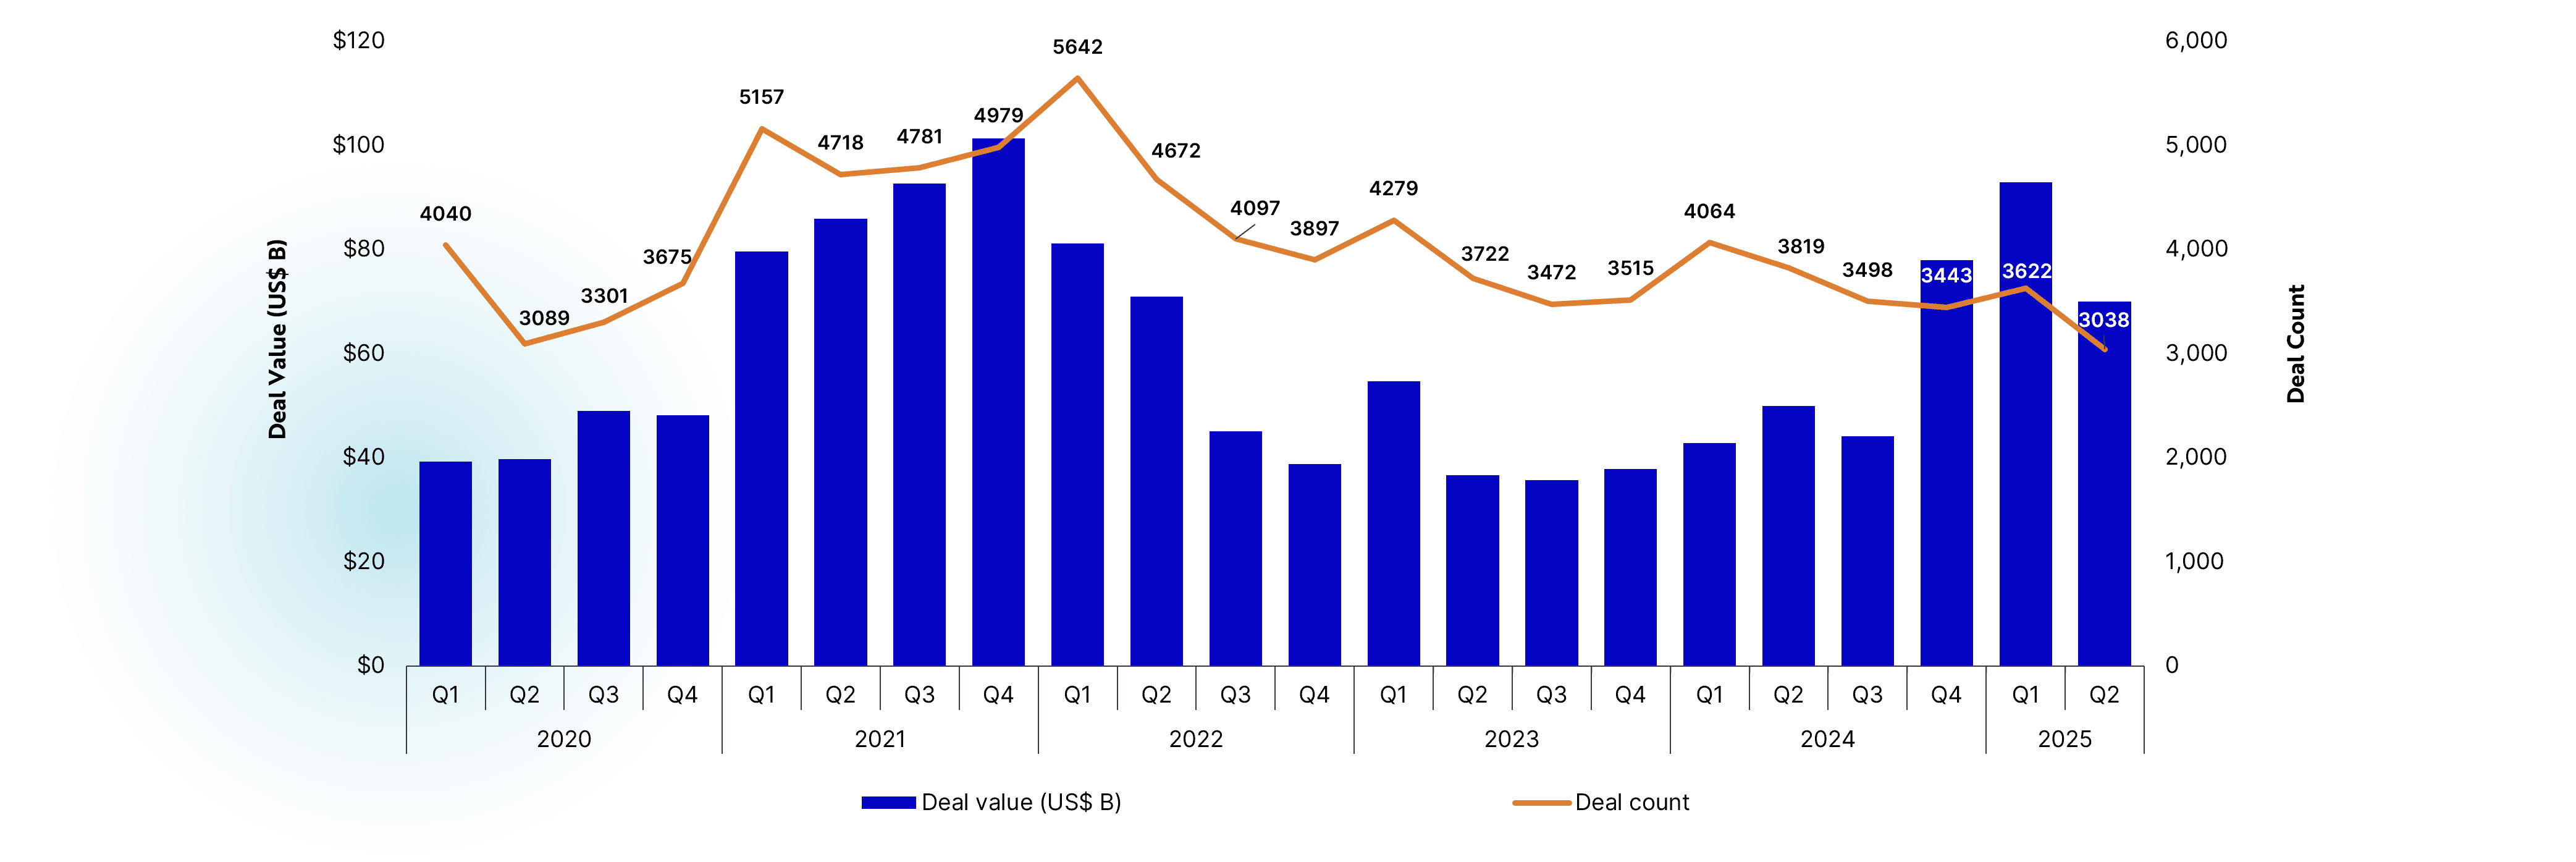
In Q2 2025, VC firms deployed US$69.9 billion across 3,038 deals (average deal size: US$23 M), representing a ~25% decline in deal value from Q1.
Proportion of Quarterly US VC Deal Value by Sector
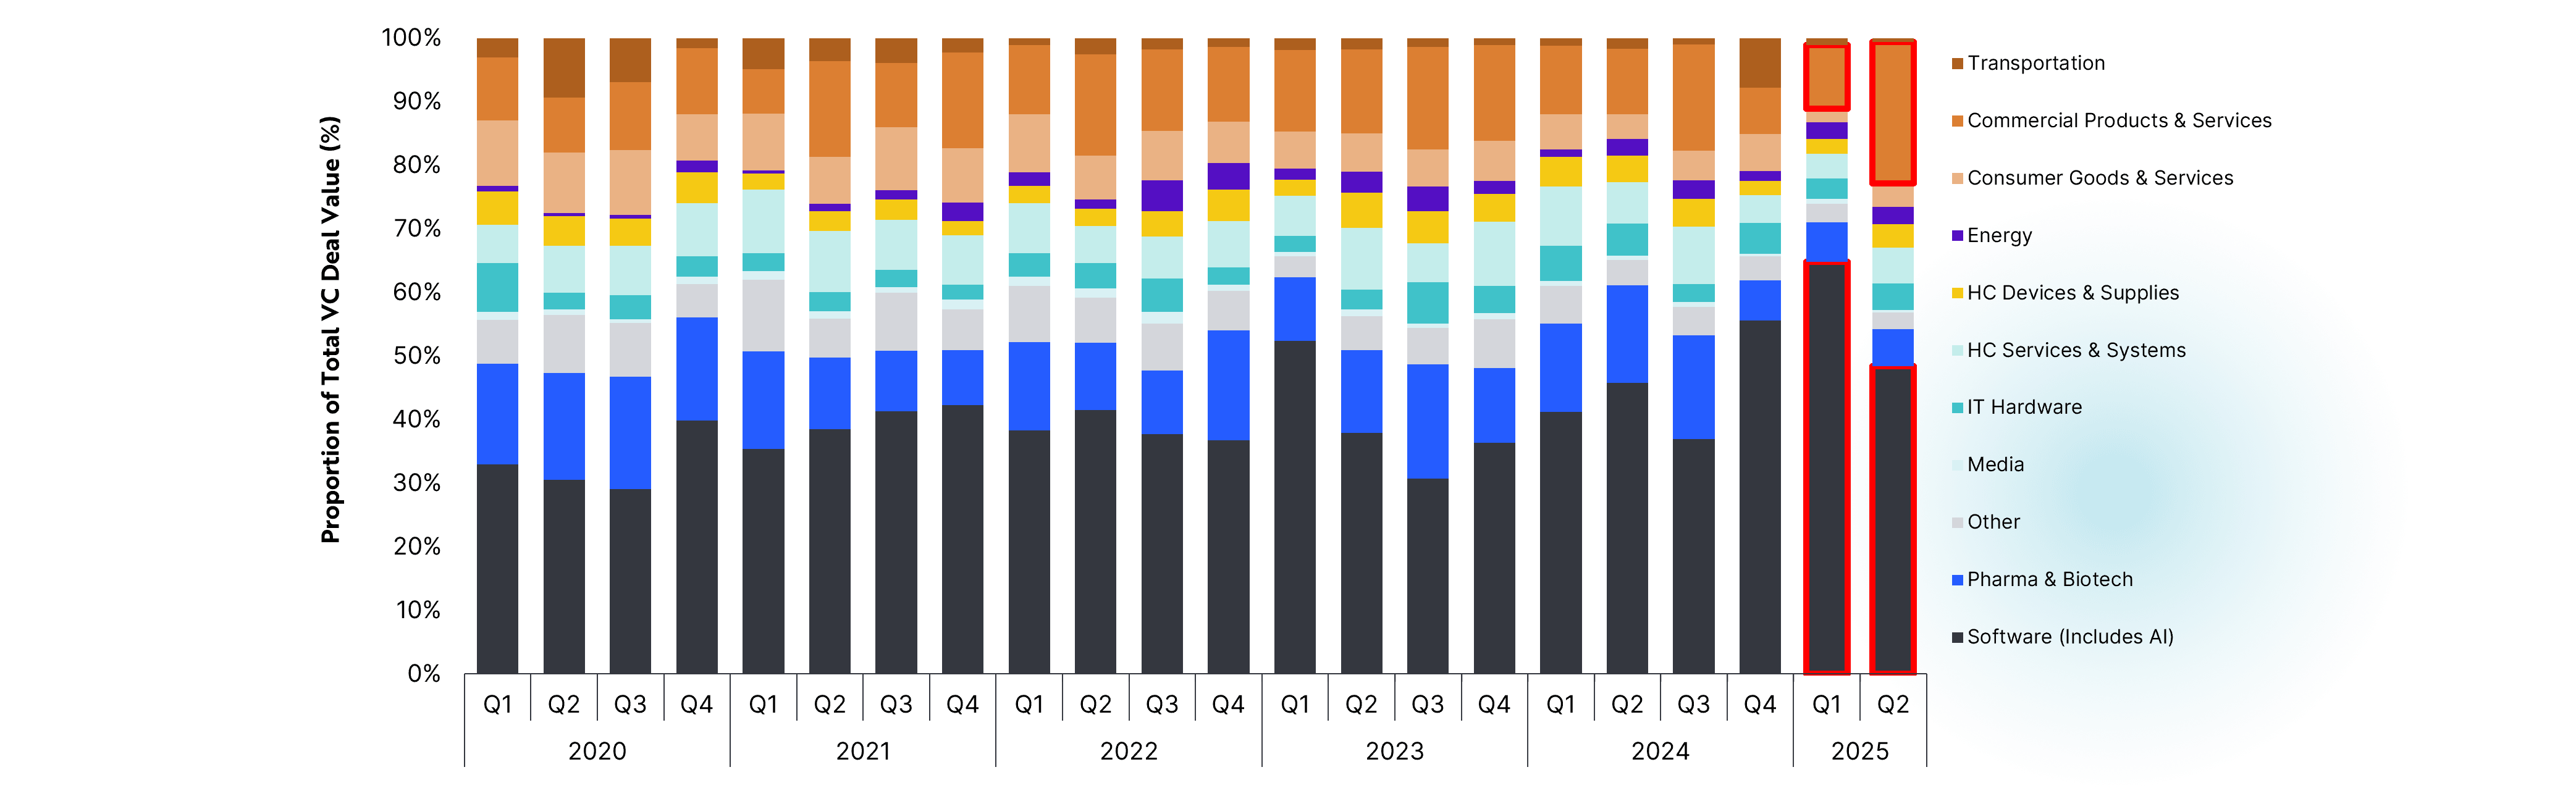
Q2 2025 dealmaking was dominated by the AI and commercial products and services sectors.
The AI sector (captured in PitchBook’s broader ‘Software’ sector umbrella) single-handedly comprised ~61% and ~36% of quarterly deal value and deal count, respectively.
AI deal value in Q2 was driven by Scale AI’s US$14.3 billion venture-growth round — the second largest VC deal to date, following OpenAI’s US$40 billion venture-growth round in Q1.
Thanks to both AI megadeals in H1 2025, annual venture-growth stage VC dealmaking is on pace for a record-setting high.
In addition to AI, the commercial products and services sector is also gaining ground — it comprised ~22% of Q2 2025 deal value, representing a ~67% increase from Q1. This sharp increase may be attributed to:
- The growth of AI, which is fueling expansion in complementary sectors, such as business tools and services — key components of the broader commercial products and services ecosystem.
- Investors being more selective with their deals, as they increasingly prioritize fewer but larger investments, in quality businesses with lower risk-reward profiles, to deliver returns to their LPs.
- IPO and secondary markets showing signs of recovery, prompting investors to further direct capital towards established businesses with current or near-term profitability and exit velocity.
- Supportive government policies such as the new 'One Big Beautiful Bill Act', which are bolstering industries in and around national security and digital infrastructure, thereby benefiting a wide range of commercial products and services businesses.
Proportion of Annual US VC Deal Count by Deal Size Bucket
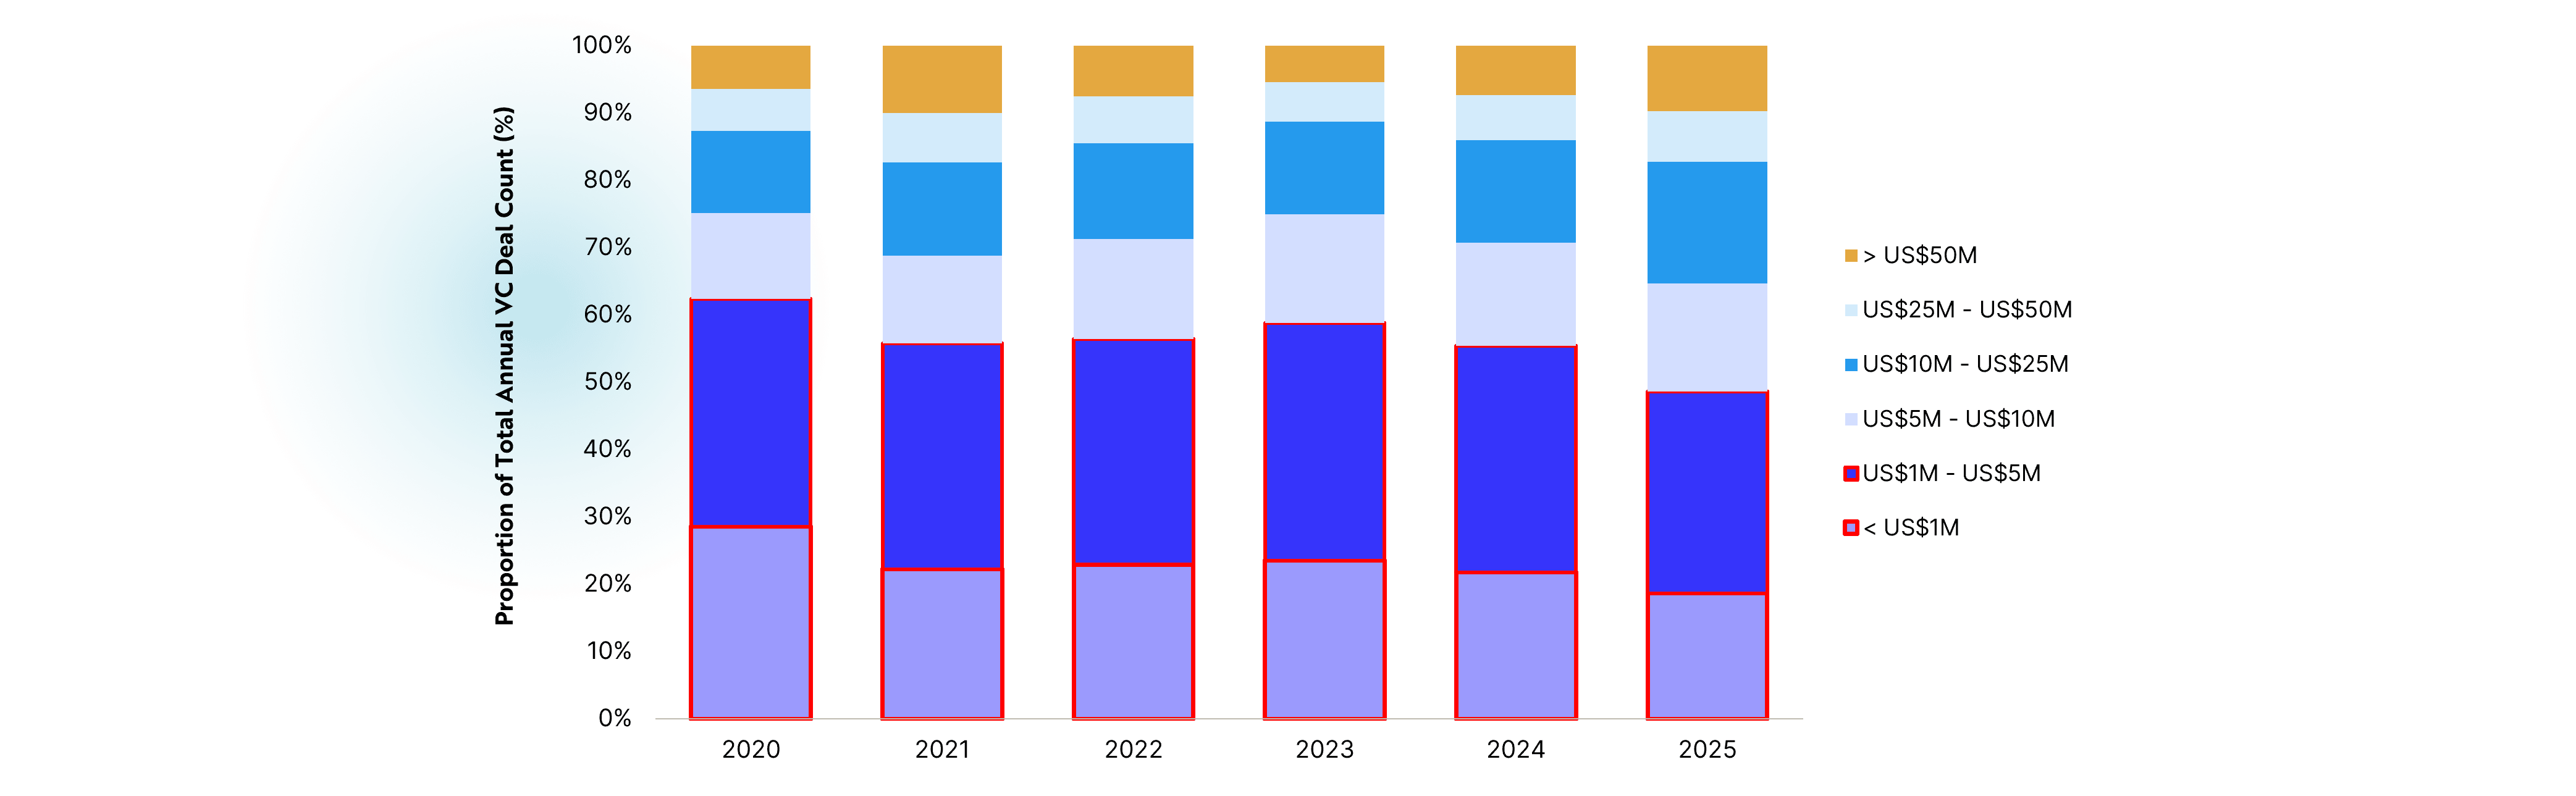 The annual share of sub-US$5 million VC deals as a proportion of total VC deal count has fallen from ~55% in 2024 down to ~49% through H1 2025, which is on pace for a decade low — further reflecting that venture investors are increasingly opting to make fewer but larger investments, in quality businesses with lower risk-reward profiles, regardless of sector.
The Gradual Rebound in Exits: IPOs & Trump Mandates
Quarterly US VC Exit Value & Count
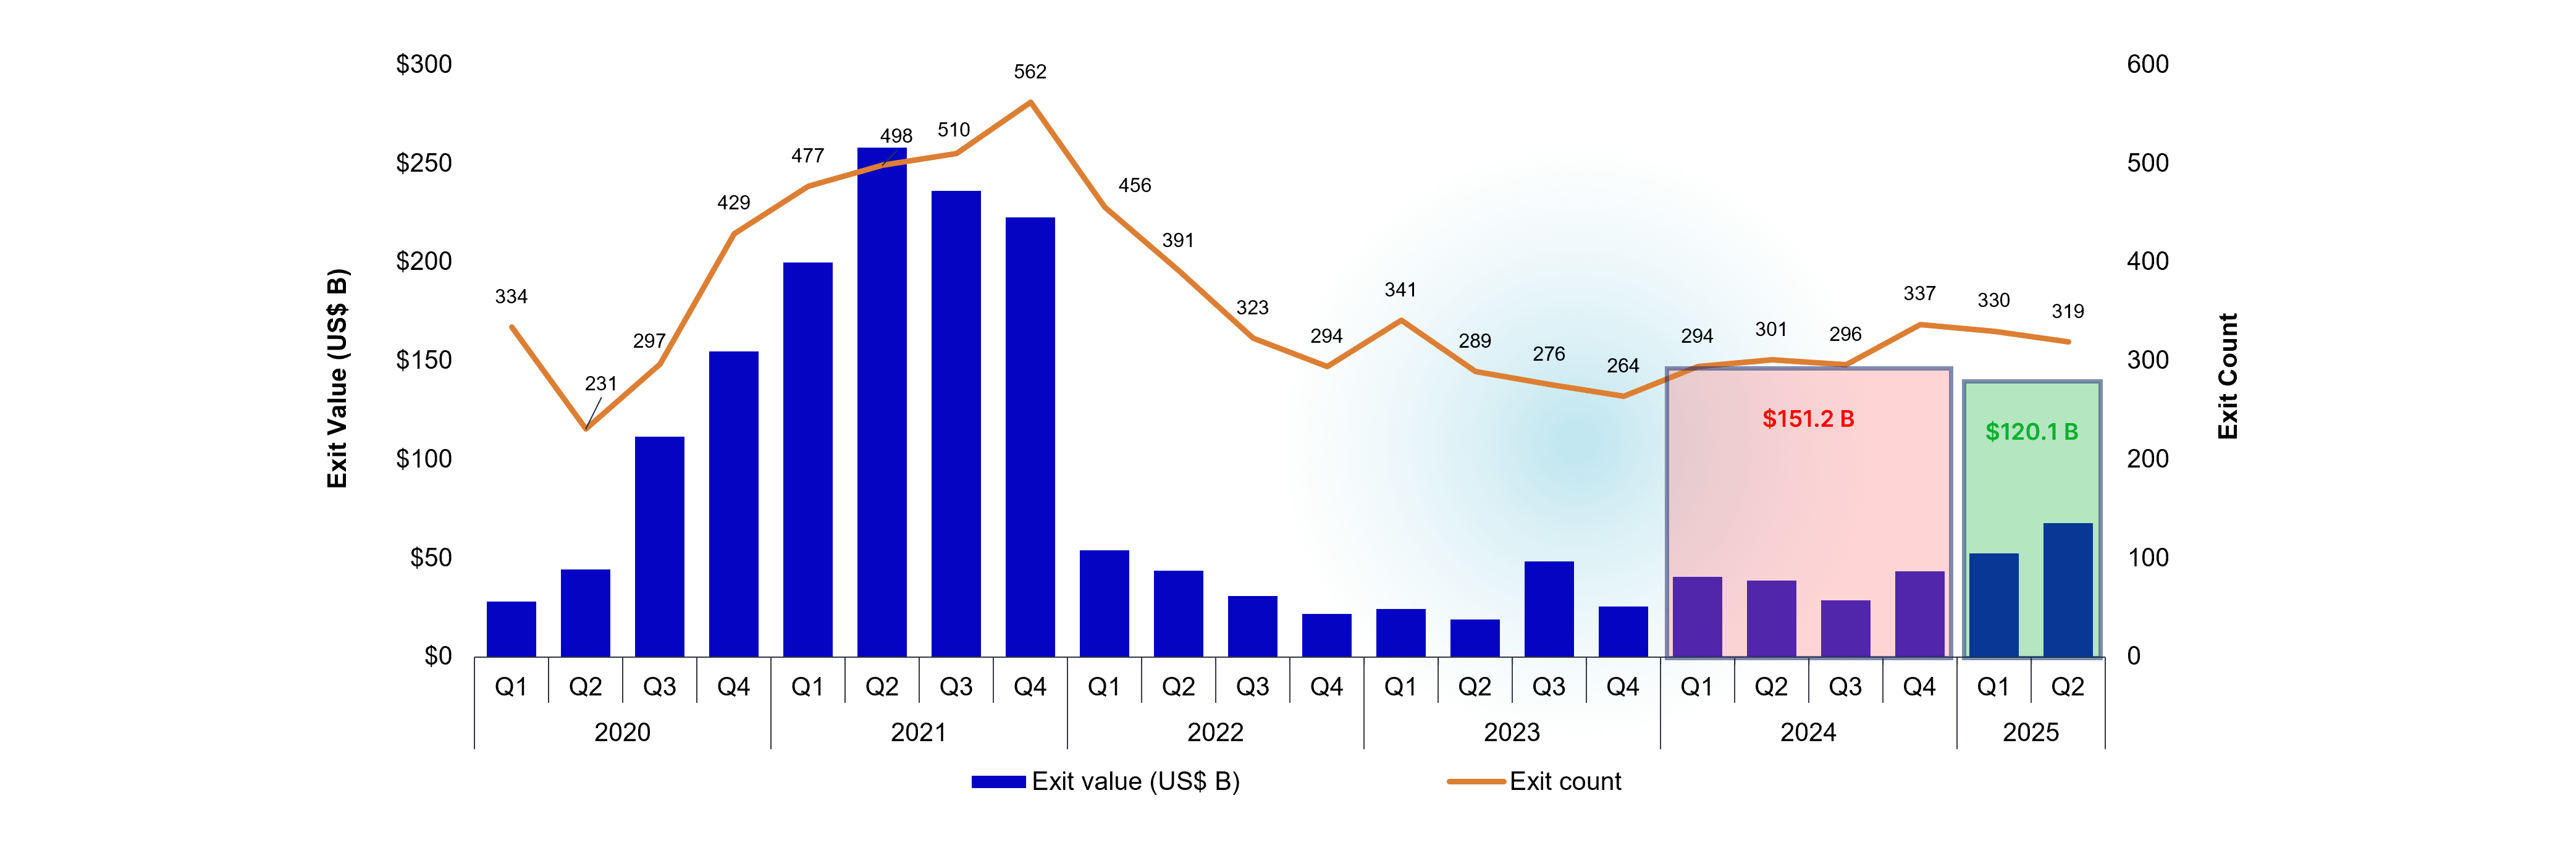
- Exit activity in Q2 2025 generated US$67.7 billion in exit value across 319 exits, which is the highest quarterly exit value since Q4 2021. Exit activity in Q2 2025 can be segmented as follows:
- M&A: acquisitions generated US$32.2 billion of exit value across 229 closed transactions.
- Buyouts: buyouts generated US$12.3 billion of exit value across 75 closed transactions.
- IPOs: IPOs generated US$23.2 billion of exit value across 15 closed transactions.
- The greatest IPO beneficiaries were in sectors that are increasingly being prioritized by the White House, such as defense tech and crypto:
- Crypto stablecoin issuer, Circle (NYSE: CRCL), went public on June 5, 2025, with a share price of US$31 and raised ~US$1.1 billion, implying a market cap of ~US$6.9 billion at IPO. The company’s market cap as of market close on July 21, 2025, was ~554% higher, at ~US$45.1 billion.
- Defense and space technology company, Voyager Technologies (NYSE: VOYG), went public on June 11, 2025, with a share price of US$31 and raised ~US$440 million, implying a market cap of ~US$1.8 billion at IPO. The company’s market cap as of market close on July 21, 2025, was ~41% higher, at ~US$2.5 billion.
- Both companies’ IPOs and trading performances may be foreshadowing what is to come over the next few years, as White House policy changes increasingly prioritize growth across the defense tech and crypto sectors. As it relates to crypto in particular, Trump has continued rolling back SEC oversight through the passage of the Guiding and Establishing National Innovation for US (GENIUS) Act, which aims at loosening regulatory constraints on digital assets.
- The greatest IPO beneficiaries were in sectors that are increasingly being prioritized by the White House, such as defense tech and crypto:
Quarterly US VC Exit Value & Count via IPO
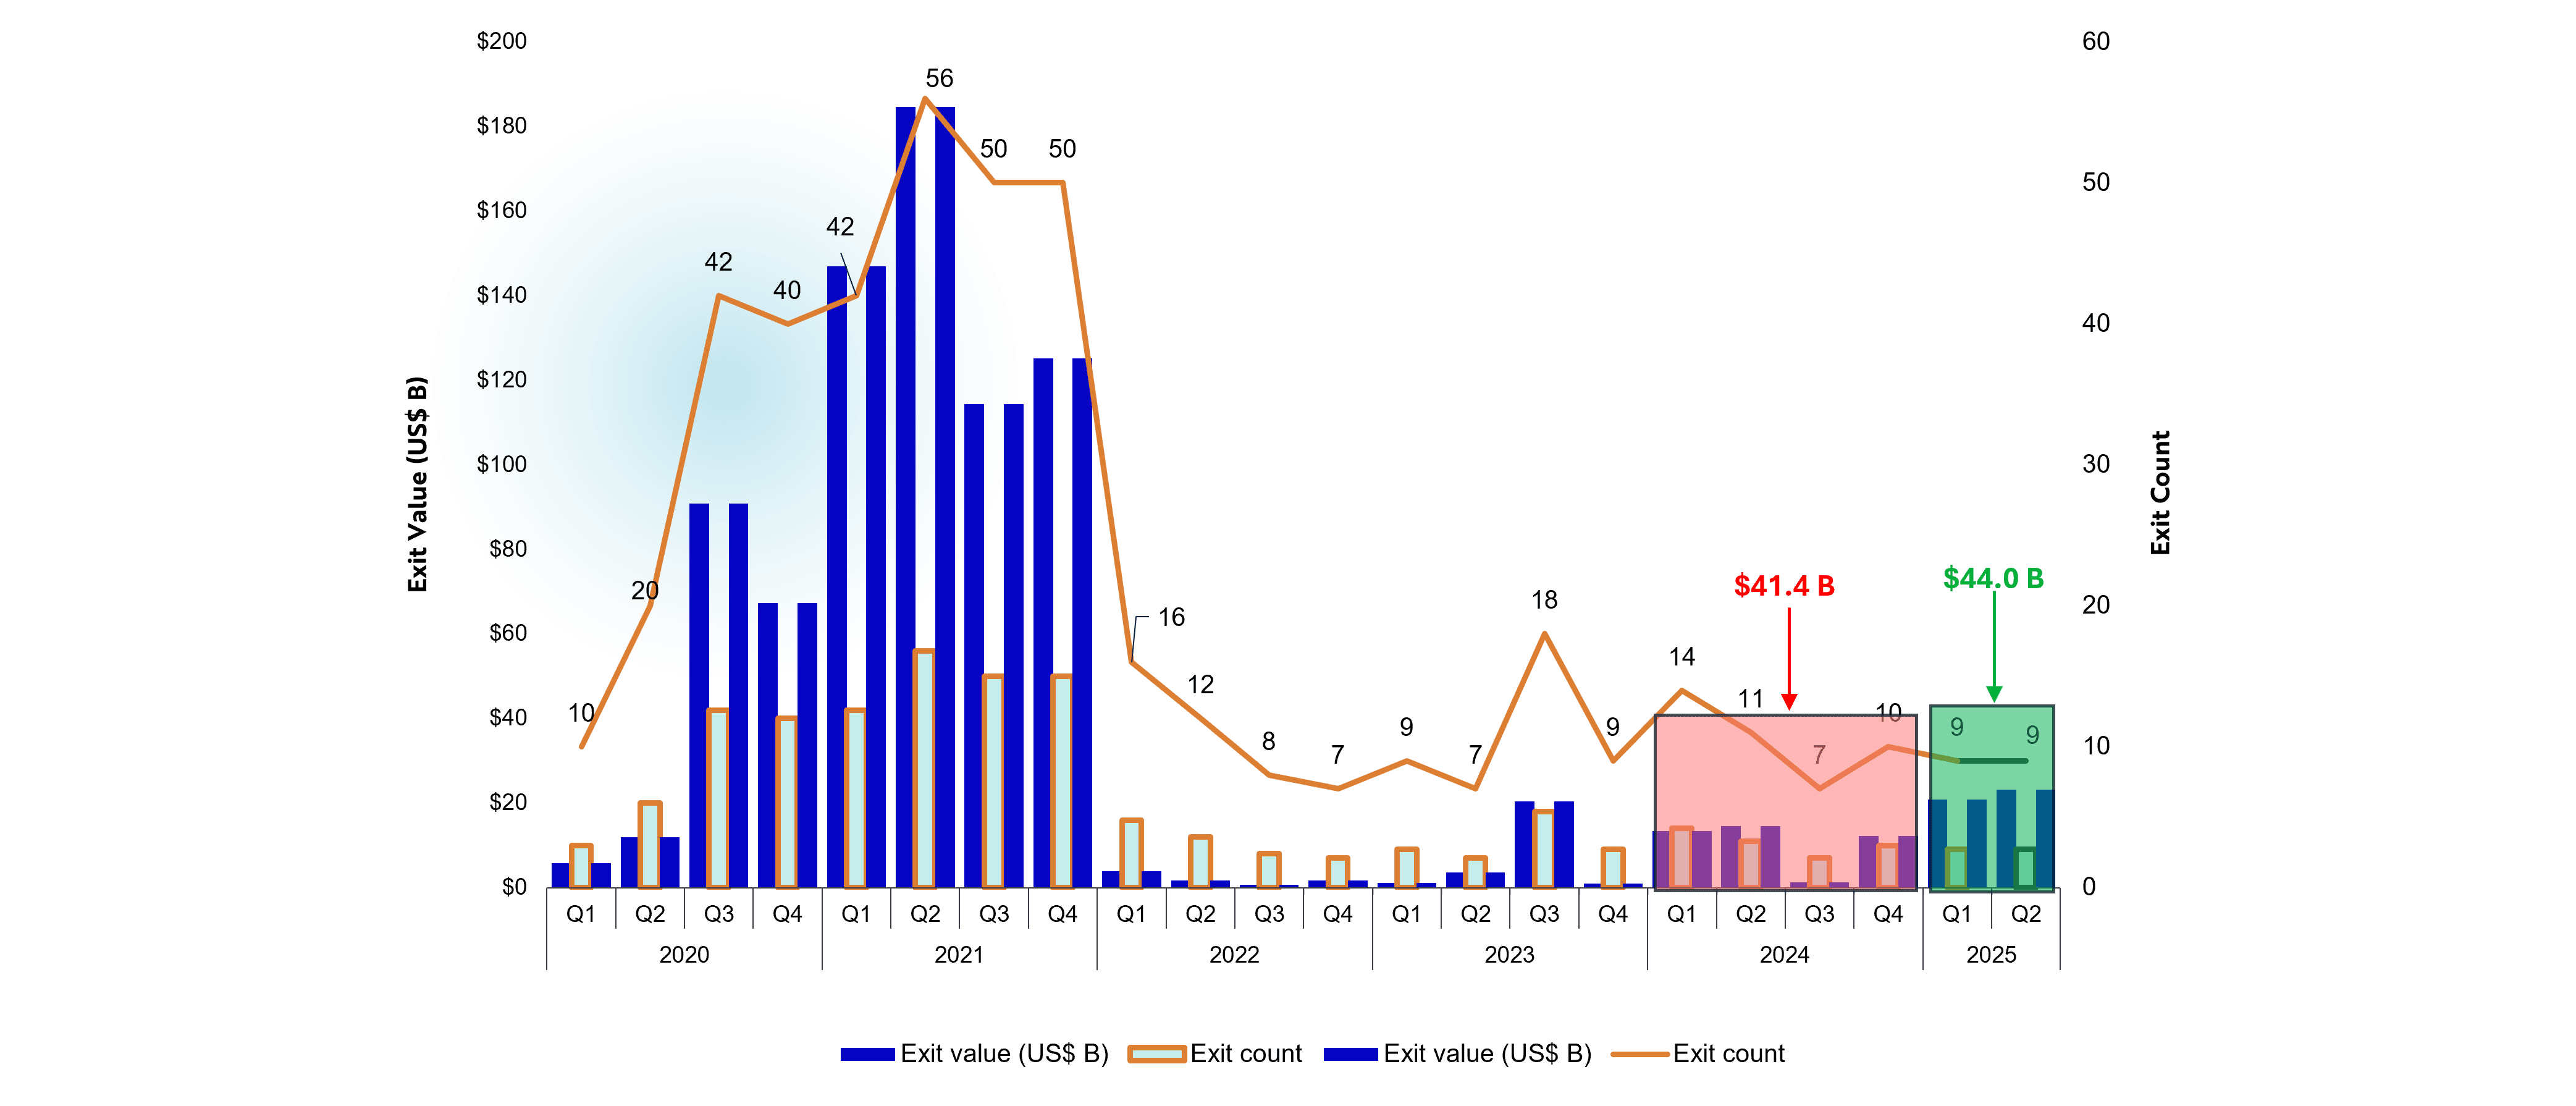 Further examining the IPO landscape, down round IPOs have become the new normal.
Corporate actions are reflecting a shift towards pragmatism, as companies are increasingly prioritizing additional capital raising and providing liquidity for shareholders as compared to holding on to pandemic-era valuations.
As such, IPO activity has rebounded significantly, with US$44 billion in IPO exit value through H1 2025 surpassing US$41.4 billion in IPO exit value through all of 2024.
IPO exit value through H1 2025 has been driven by fewer but larger exits — there were six IPOs with pre-money valuations exceeding US$1 billion, including Circle and Voyager Technologies’ IPOs in June.
Quarterly US VC Dealmaking Indicator
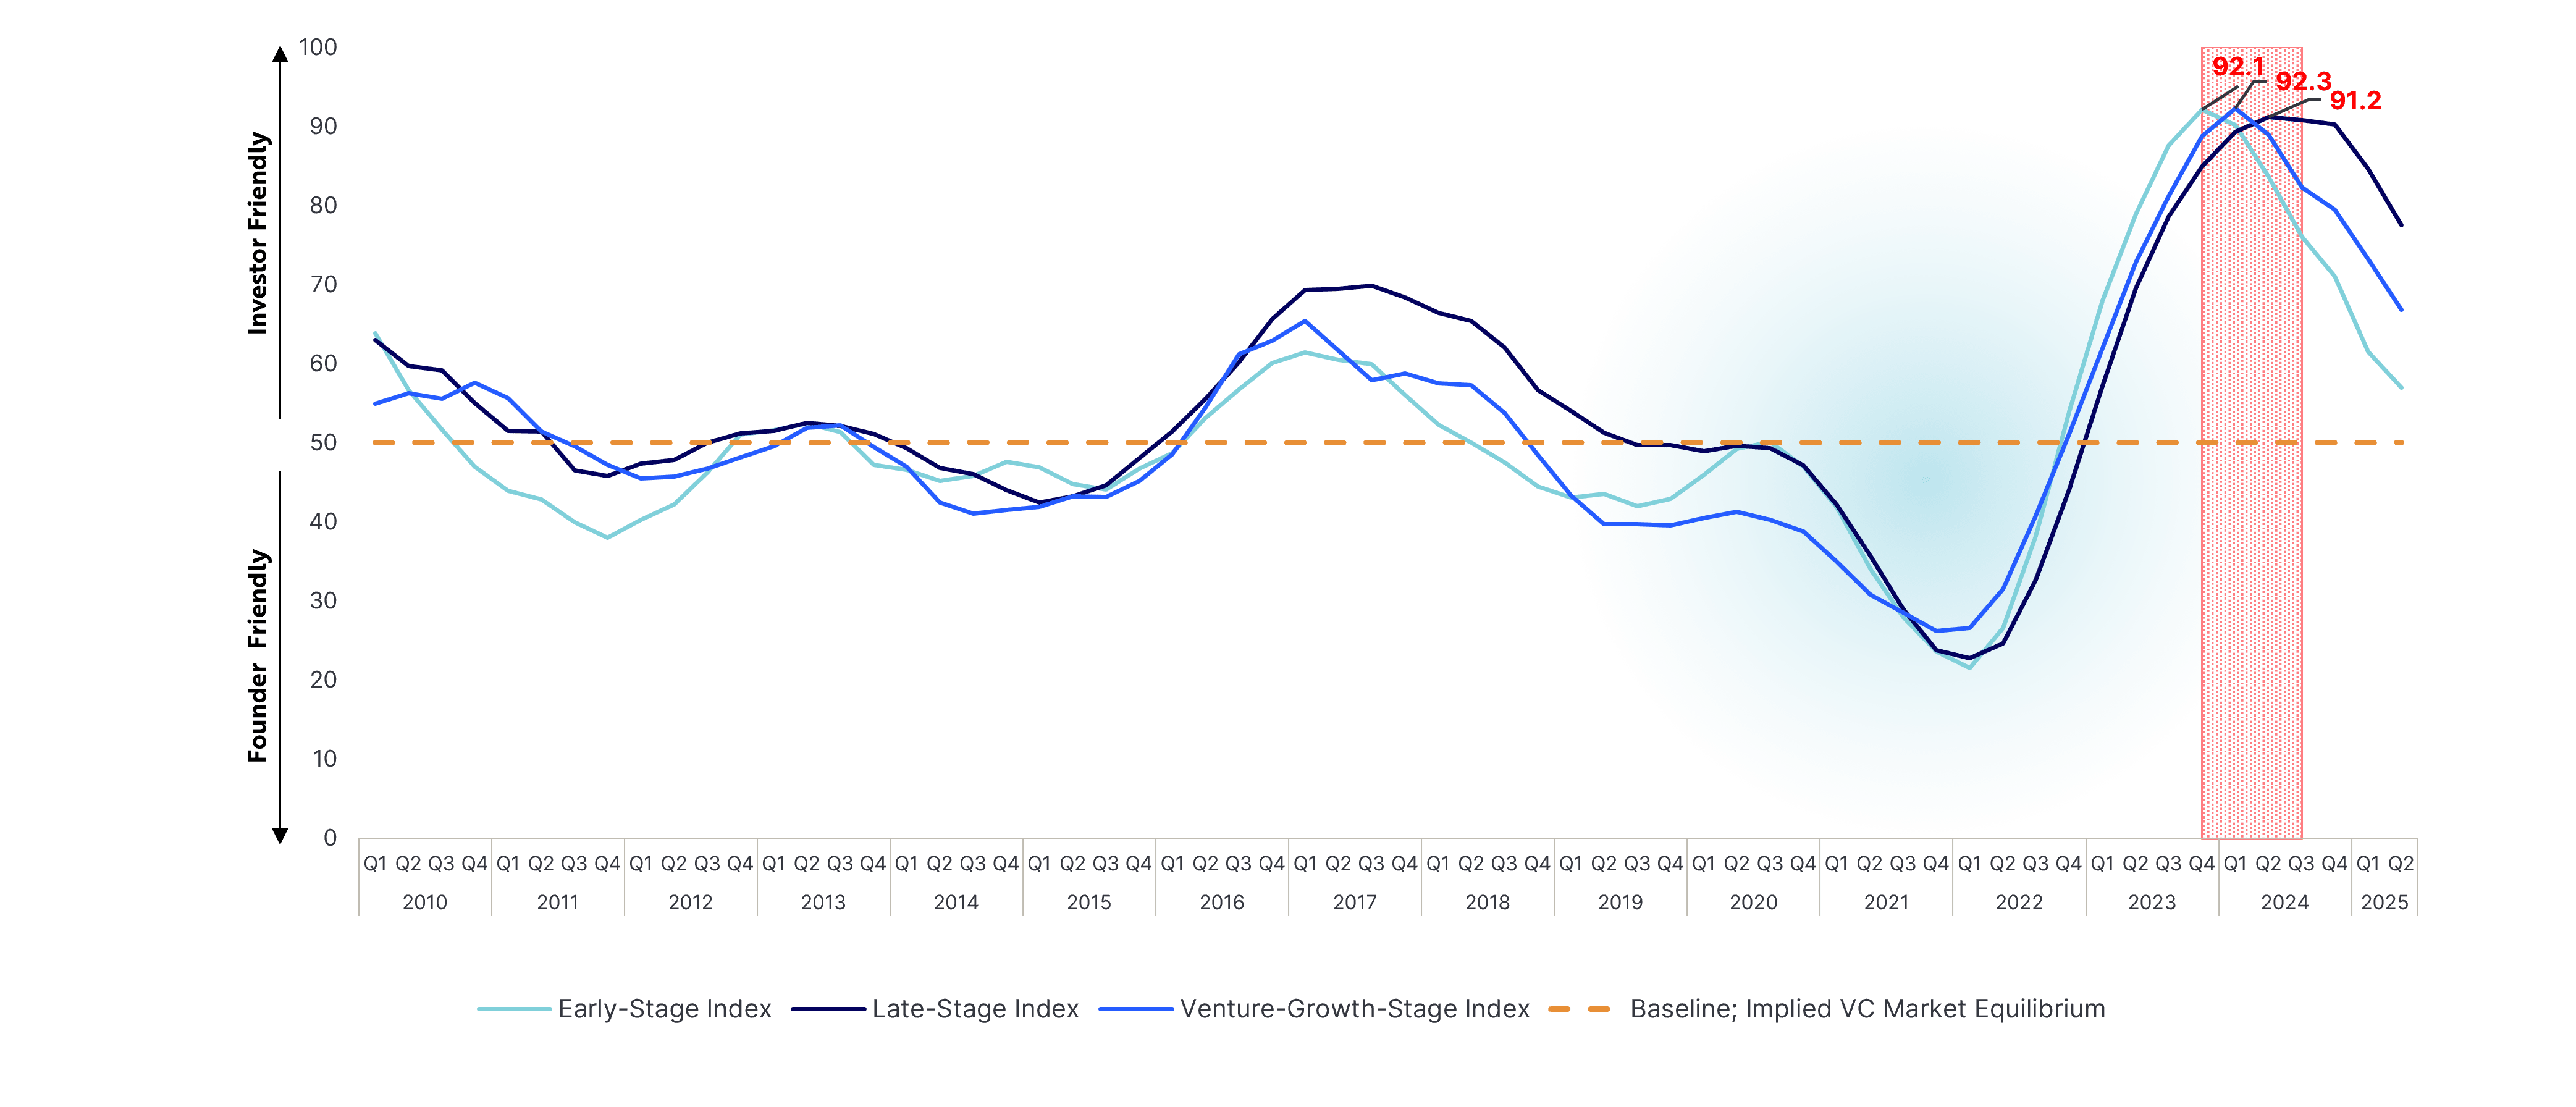 Between Q4 2023 and Q3 2024, PitchBook's VC dealmaking indicator tracked all-time highs across all venture deal stages, indicating that this 12-month period was the most asymmetrical VC market on record, in favour of investors.
Despite limited GP fundraising success, more concentrated, competitive deal activity + increased exit activity appears to be spurring the capital flywheel in VC and ultimately helping to restore the balance in dealmaking dynamics between investors and entrepreneurs from H1 2025 onwards.
Amidst these evolving market dynamics, legislative developments are also primed to influence the trajectory of VC dealmaking.
The One Big Beautiful Bill Act: The Transient Future of Venture Capital Deal Making
Q2 2025 effectively culminated in the signing of the One Big Beautiful Bill Act on July 4, 2025. The bill marks some clear advantages and disadvantages for the US venture capital ecosystem.
Advantages:
- Carried interest tax treatment rules preserved — the bill made no changes to the carried interest rule, preserving the existing tax advantage for general partners in VC funds.
- Qualified Small Business Stock (QSBS) rules expanded — the bill expanded QSBS rules to encourage long-term investment, making it more attractive to invest in and hold small business stock for angel and early-stage investors.
Immediate domestic R&D expensing rules restored — the bill allows companies to immediately expense domestic - R&D costs, which is a positive signal for US-based and focused biotech, AI, and deep tech companies, as it will lower their effective tax burdens and improve their cash flow profiles.
Disadvantages:
- University endowment tax overhaul — the bill introduced a three-tiered excise tax on university endowments for universities with at least 3,000 students, potentially impacting VC fundraising pipelines for venture funds with universities as limited partners.
- Restrictions on clean energy credits — while the bill phases out wind and solar tax credits for projects placed in service from 2028 onwards, the more direct impact for VCs appears to lie within constrained eligibilities and shortened timelines for tax credits tied to emerging technologies such as geothermal power and long-duration energy storage. These emerging spaces are beginning to gain traction with early-stage investors, yet the tighter windows for credit qualification and increased compliance complexity, especially under Foreign Entity of Concern (FEOC) restrictions, may complicate capital commitments and slow commercial deployments. As a result, VCs likely need to exercise greater diligence and elongate their planned investment / exit timelines when backing companies in these spaces, although broader momentum for climate innovation continues to build.
Overall, the One Big Beautiful Bill Act offers tax and R&D incentives that benefit early-stage investing but introduces challenges for university LPs and clean energy VCs due to tighter credit restrictions.
Although the long-term impact is unclear, a few key industries, such as defense tech, AI, fintech, and crypto would potentially reap the greatest benefits.
Connecting the Dots
The Q2 2025 venture landscape reveals a concerning interconnected cycle that threatens long-term sector health:
- Limited GP fundraising success across the board, especially across first-time managers.
- Concentrated AI and commercial products and services investments, crowding out capital for other sectors.
- Heightened competition for capital, prompting fewer but larger investments into growth-stage ventures with clear traction and trajectories, regardless of sector.\
- Increased IPO exit activity, with key sectors increasingly prioritized by the Trump administration reaping the greatest benefits thus far.
- The One Big Beautiful Bill Act, altering VC market dynamics, and prioritizing growth across key sectors under the Trump administration.
This cycle becomes self-reinforcing as each element amplifies the others, creating a challenging environment for sustainable venture ecosystem growth.
Raising Capital is Tough. You Can be Ready.
Market conditions demand that companies seeking capital must level up the quality of their opportunity – which means building a stronger, more resilient business, and diligently prepare to compete for investment.
Tailwind Ventures empowers early- and growth-stage companies to navigate the increasingly competitive landscape, withstand the scrutiny of due diligence, and secure capital. Our diligent preparedness process improves the risk-reward relationship for ventures and investors, increasing the likelihood of investor conviction. Tailwind Ventures has raised nearly $400 million for clients since 2022.
Data Notes:
Data appearing in this summary use datasets from Pitchbook-NVCA Venture Monitor Q1 2025 and CVCA Canadian Venture Capital Market Overview Q1 2025.
1: PitchBook’s VC Dealmaking Indicator metric is outlined as follows:
- What it measures: it assesses the favourability of the venture fundraising / investing market for ventures / investors, across each stage of the market (early-stage, growth-stage, and late-stage),
- How to interpret the assessment: a score of 50 implies market equilibrium, in which venture dealmaking power dynamics are balanced between ventures and investors. The higher the score above 50, the higher the indication that it is an investor-friendly market. The lower the score below 50, the higher the indication that it is a venture-friendly market.
- The methodology: the Dealmaking Indicator reflects key deal terms and attributes captured across three categories of PitchBook data:
- Market liquidity measures (capital demand-supply ratio, startup funding rate)
- Cap table information (cumulative dividends, liquidation participation, percentage acquired)
- Momentum metrics (years between VC rounds, valuation change)